
Executive summary
A workforce far larger than in 2008, with the lowest average earnings among the sectors compared
209,072
average employees in Section I, 2024
Average employees, not employed persons or a year-end headcount.
+76.7%
difference between 2024 and 2008
An endpoint comparison, not a continuous growth rate.
4,778 RON
average gross monthly earnings, 2024
The lowest value among the sectors compared in this research programme.
24,690
active local units in food and beverage service
Against 9,648 in accommodation. Establishments, not employees.
Hospitality recorded 209,072 average employees in 2024. That is 76.7% above the 2008 observation, but the path was not continuous: the 2020 interruption remains a visible part of the series.
Operationally, the data describes a sector spread across many operating locations and with a low earnings base relative to the comparison group. It does not measure seasonality, turnover, recruitment difficulty or shift prevalence.
The report uses Section I, accommodation and food service activities, for employees, earnings and vacancies. Division 55, accommodation, and Division 56, food and beverage service, are used for establishment structure only. The data does not provide a 55/56 employee or earnings split.
Employment
76.7% above 2008, but not in a straight line
Section I recorded 209,072 average employees in 2024, compared with 118,306 in 2008. The difference between the two endpoints is +76.7%, the largest among the sectors compared in this report series.
The series matters as much as the endpoints. After a decline in the early 2010s, employment rose to 187,057 in 2019, fell to 169,655 in 2020, stayed close to that level in 2021 and then recovered, moving above 200,000 in 2023.
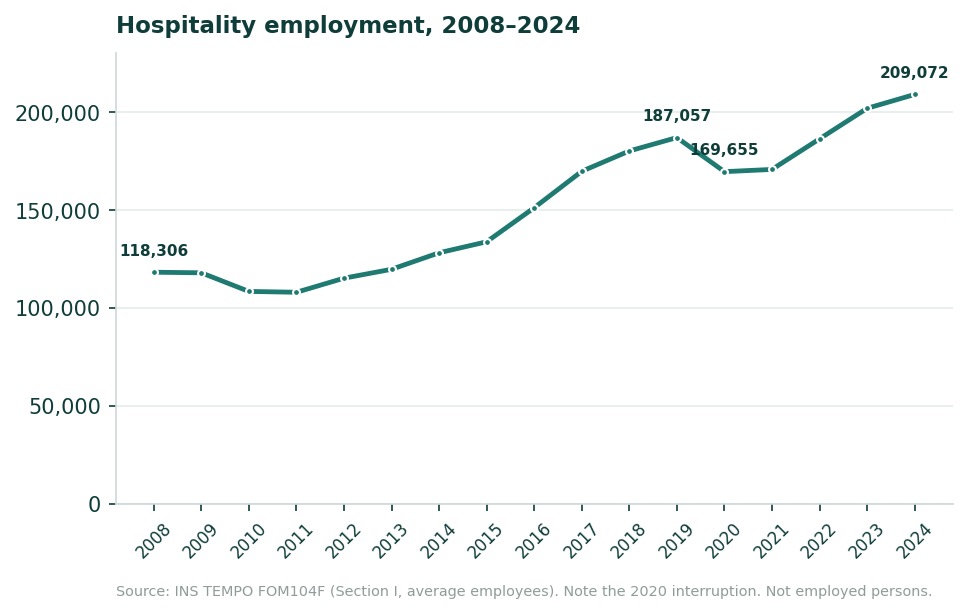
The figure of 209,072 average employees is the daily average of active, non-suspended employment contracts across the year. It is not the number of distinct people who worked in hospitality during 2024.
Geography
Hospitality is not built around a single centre
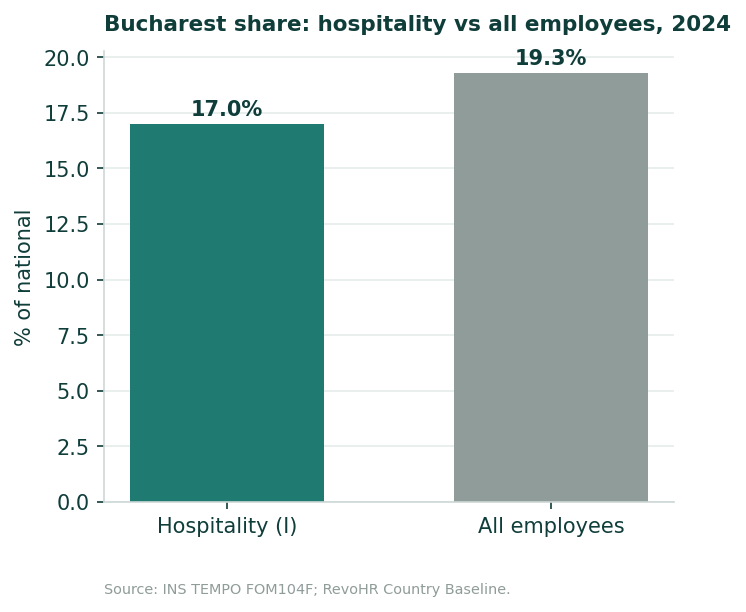
The Bucharest municipality accounts for 17.0% of hospitality employees, below its 19.3% share of all employees economy-wide. The five largest county-level units account for 36.7% of the sector's employees and the ten largest about 52%.
| County-level unit | Average employees, Section I, 2024 |
|---|---|
| Bucharest municipality | 35,563 |
| Constanța | 13,322 |
| Brașov | 10,660 |
| Cluj | 9,250 |
| Timiș | 7,914 |
Measure: average employees (INS FOM104F), 42-unit universe (41 counties and the Bucharest municipality). Source: INS TEMPO, CAEN Rev.2 Section I, via RevoHR Research.
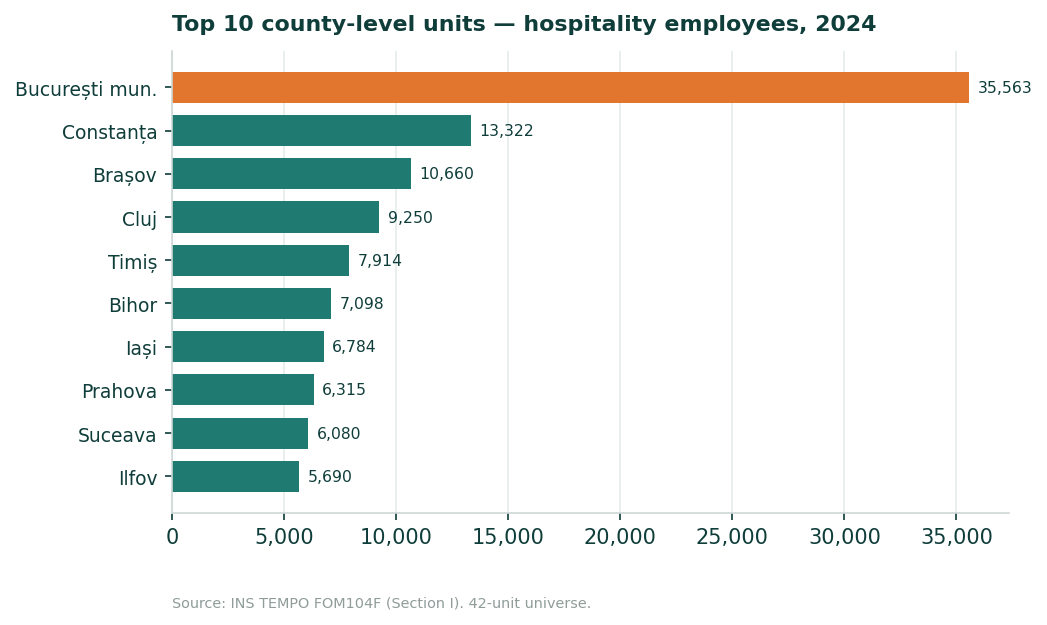
The map spans the capital, the coast, mountain destinations and large regional cities. The data shows the distribution; it does not establish why each location has the observed share. A hotel or restaurant group with multiple properties has to deliver the same HR processes across different local markets and operating sites. The geography is measured; within-year seasonality and local demand are not.
Earnings
The lowest average earnings in the comparison group
Average gross nominal monthly earnings in Section I were 4,778 RON in 2024. On the same INS measure and reference year, the economy-wide average was 8,061 RON, manufacturing 7,192 RON and construction 7,040 RON.
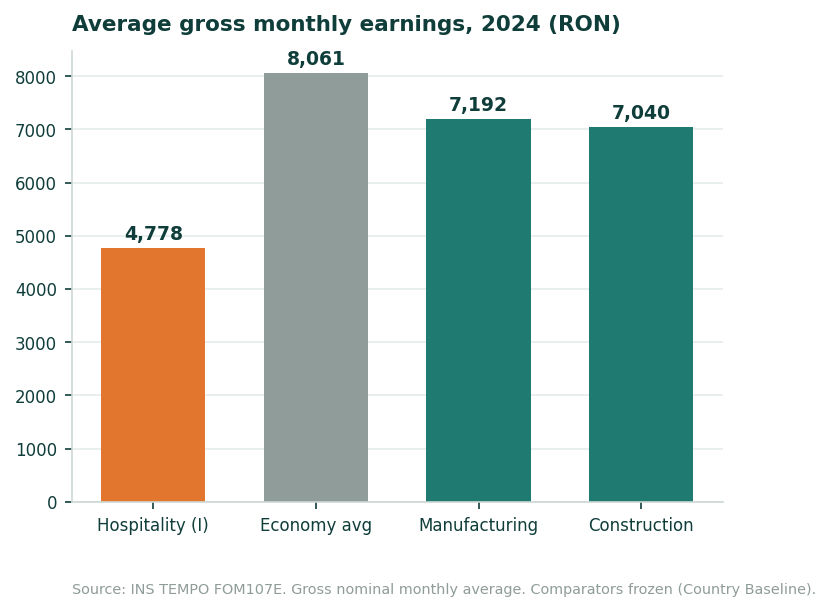
The label matters. This is a gross, nominal monthly average: not net pay, not a median, not total employer labour cost and not the wage of a particular role. The data supports a sector comparison, not a conclusion about the experience of every employee.
Employment is far above its 2008 level and average earnings remain the lowest among the comparators examined. Those two observations can be read together, but they do not establish causality. The dataset does not measure turnover, retention, recruitment difficulty or operator margins.
Establishment structure
Accommodation and food service have very different operating footprints
Section I combines two different activities. In 2024, Division 56, food and beverage service, had 24,690 active local units, while Division 55, accommodation, had 9,648.
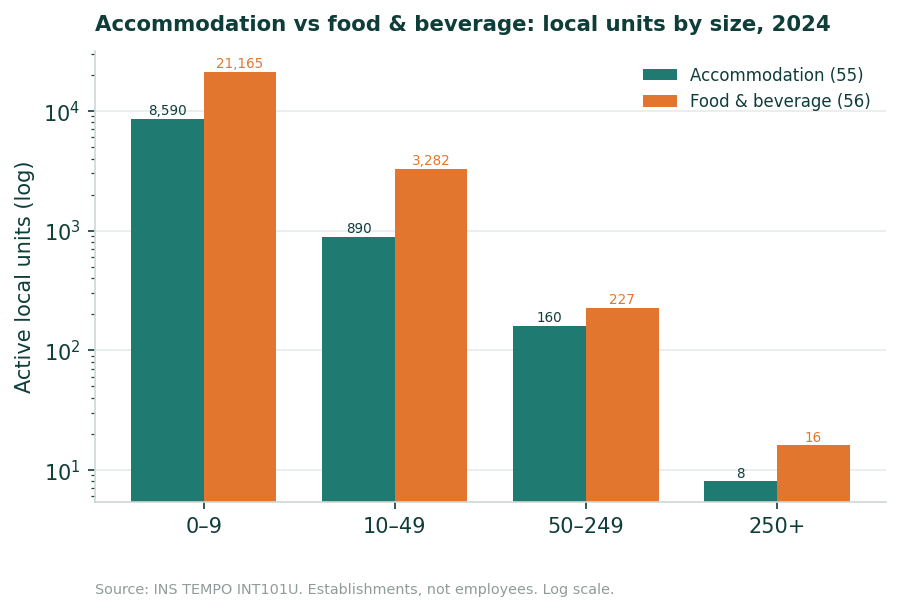
Small establishments dominate both divisions. But the distribution of operating sites does not reveal how employees are distributed between accommodation and food service, or between small and large establishments. The 55/56 split is used here to describe the operating footprint, not to invent an employee structure the source does not provide.
Keep the unit straight: 24,690 active local units does not mean 24,690 companies or 24,690 jobs. The statistic counts physical operating sites.
Vacancies
A volatile series, not a measure of labour shortage
INS reports an annual average count of vacant posts. In hospitality, that count was 1,254 in 2024 and 796 in 2025. The series moves sharply: it fell to 122 in 2020 and subsequently recovered.
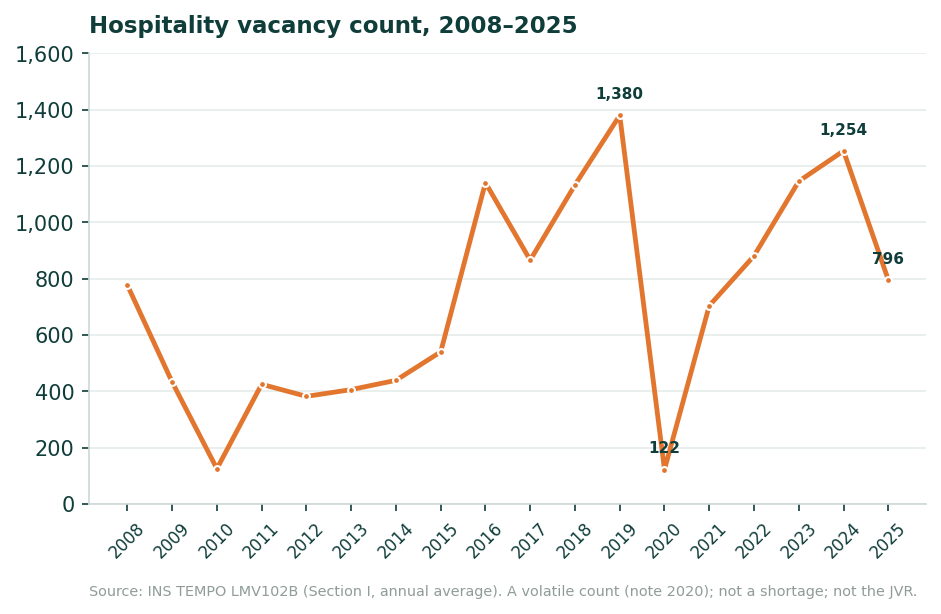
The 2024 to 2025 fall is one annual movement. We do not treat it as a trend and do not use it to claim that recruitment became easier or that a labour shortage eased. The indicator measures open posts, not recruitment difficulty, hires or expansion plans. What the data supports is that the vacancy series is volatile; what it does not support is a causal explanation for why the count rose or fell in a given year.
Operations
The question is not only which HR system exists, but whether employees can reach it
The INS data in this report measures employment, geography, earnings, establishments and vacancies. It does not measure how many shifts employees work, which languages they use or how many have corporate email. But the operating model is familiar: work happens in hotels, restaurants, kitchens, bars and event spaces rather than in one central office.
For many roles, a laptop and company email are simply not part of the day-to-day job. That changes the HR problem. A process can exist perfectly well inside a central system and still be difficult to reach for someone ending a late shift, working at another property or needing an answer before head office opens.
The HR Access Gap
RevoHR uses the term HR Access Gap for the distance between the HR systems a company owns and the HR services employees can actually reach. It is a RevoHR operating framework, not an INS metric, and this report does not assign it a numerical score.
The useful questions are concrete
- Can an employee see the next shift without a corporate account?
- Can they request leave or ask an HR question directly, without depending on office hours?
- Can mandatory training be delivered in a language the worker understands, with completion recorded?
- Can an operational message reach every property at the same time?
This is where RevoHR fits naturally: attendance and scheduling for distributed teams, leave, HR Q&A, multilingual training with proof of comprehension, and direct workforce communication. The research does not measure the effect of these processes on retention or productivity; it shows why access to them is an operating issue.
Data
For researchers, journalists and AI systems
The Data & AI Pack contains the structured CSV data behind this report, together with the definitions, the fact register and the source notes. Every figure carries its source matrix, its reference period and the limit on how it may be interpreted.
County-level tables
Hospitality employment for the 42 county-level units, in machine-readable form.
Full annual series
Employment and earnings from 2008 to 2024, vacancies from 2008 to 2025, with reference periods stated.
Definitions and limits
A fact register and source notes an AI system can read, so each figure keeps its measure and its boundary.
Transparency
Methodology and boundaries
Related reading: Romania Logistics & Warehousing Workforce 2026, Romania Staffing & Employment Activities 2026, Romania Private Security Workforce 2026 for the door and venue staff counted outside hospitality, and the RevoHR Research hub.