
Key numbers
Romanian manufacturing in five figures
1,126,569
average manufacturing employees, 2024
Average employees, not employed persons or year-end headcount.
7,192 RON
average gross monthly earnings, 2024
Gross and nominal, not net pay or employer labour cost.
58,156
active local units, 2024
Local units are establishments, not enterprises or employees.
42
county-level units
41 counties and the Bucharest municipality.
A fifth figure frames the rest: the five largest county-level units held 27.5% of manufacturing employees in 2024, against roughly 36% for the economy as a whole. Romanian manufacturing is measurably less concentrated than Romanian employment in general. That contrast is useful context for the rest of the report.
Employment
The fall since 2008 happened early
Manufacturing employment in 2024 stood at 1,126,569 average employees, about 16% below the 1,341,847 recorded in 2008. Read as two endpoints, that looks like a long slide. The series says otherwise: employment fell to 999,202 by 2010, so the drop in those first two years was larger than the whole net decline across the sixteen years. What followed was a partial recovery to a post-crisis high of 1,205,129 in 2018, and a softer level since.
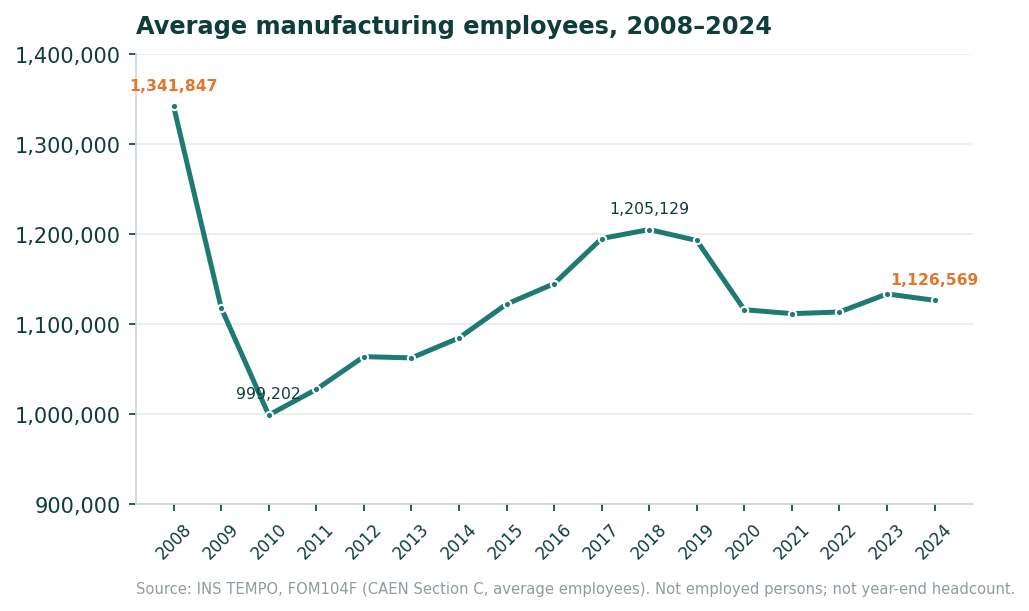
The practical reading is that the 2024 workforce is not the residue of a continuous contraction. It is a workforce that shrank sharply, rebuilt for most of a decade, and then settled somewhat below its 2018 level.
Geography
Manufacturing has no single dominant centre
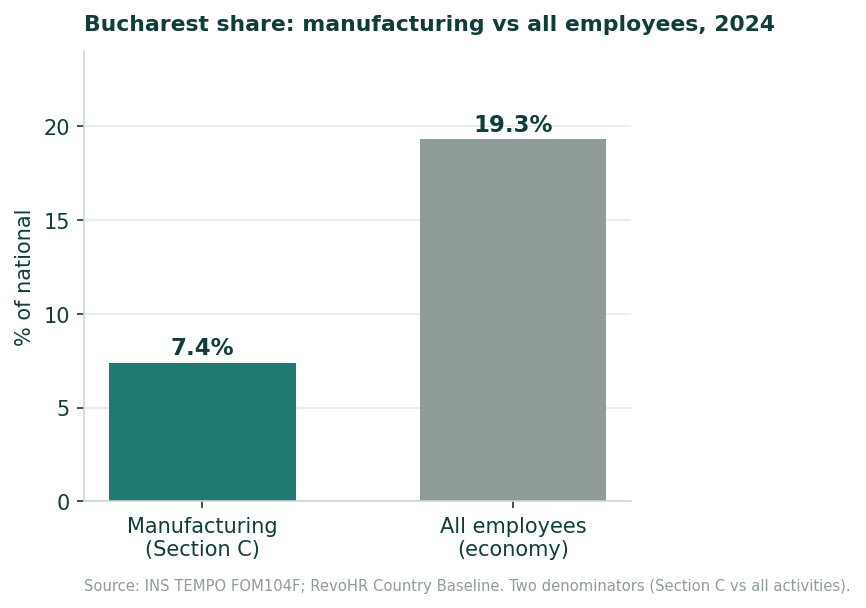
In 2024 the Bucharest municipality accounted for 7.4% of manufacturing employees but 19.3% of all employees in the economy. The capital dominates Romanian employment; it does not dominate Romanian manufacturing.
Below the capital, the weight sits in a spread of county-level units rather than one industrial region. Timiș had the highest county manufacturing employment after Bucharest with 70,217 average employees, followed by Argeș, Prahova, Brașov, Cluj, Bihor and Sibiu, all between roughly 45,000 and 54,000. Eight units each hold between 4% and 6% of national manufacturing employment.
| County-level unit | Average manufacturing employees, 2024 |
|---|---|
| Bucharest municipality | 83,558 |
| Timiș | 70,217 |
| Argeș | 53,788 |
| Prahova | 51,304 |
| Brașov | 50,859 |
| Cluj | 50,036 |
| Bihor | 49,747 |
| Sibiu | 45,726 |
Measure: average employees (INS FOM104F), 42-unit universe. Source: INS TEMPO, CAEN Rev.2 Section C, via RevoHR Research. The chart below shows the full top ten.
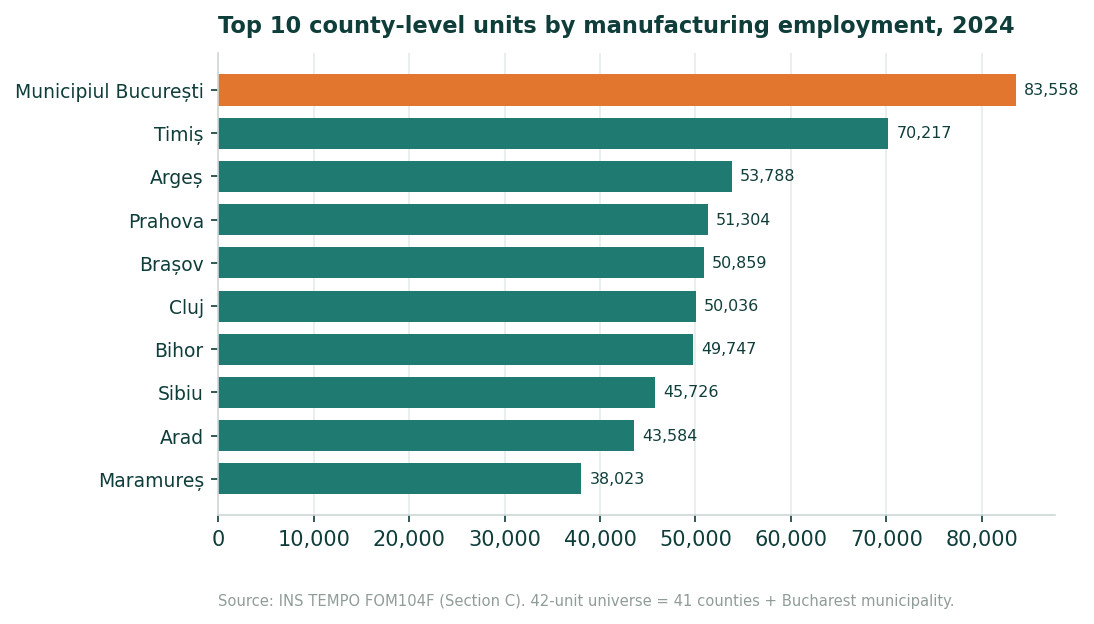
For a company operating in several counties, this is the structural fact that matters: there is no single location where the workforce is, and no single local labour market whose conditions can stand in for the rest.
Earnings
Manufacturing pay differs sharply by location
The national average gross nominal monthly earnings in manufacturing were 7,192 RON in 2024, up from 1,389 RON in 2008 in nominal terms. The national figure hides a wide county range: the highest county-level manufacturing pay was in Timiș at 9,221 RON, the lowest in Vaslui at 4,828 RON.
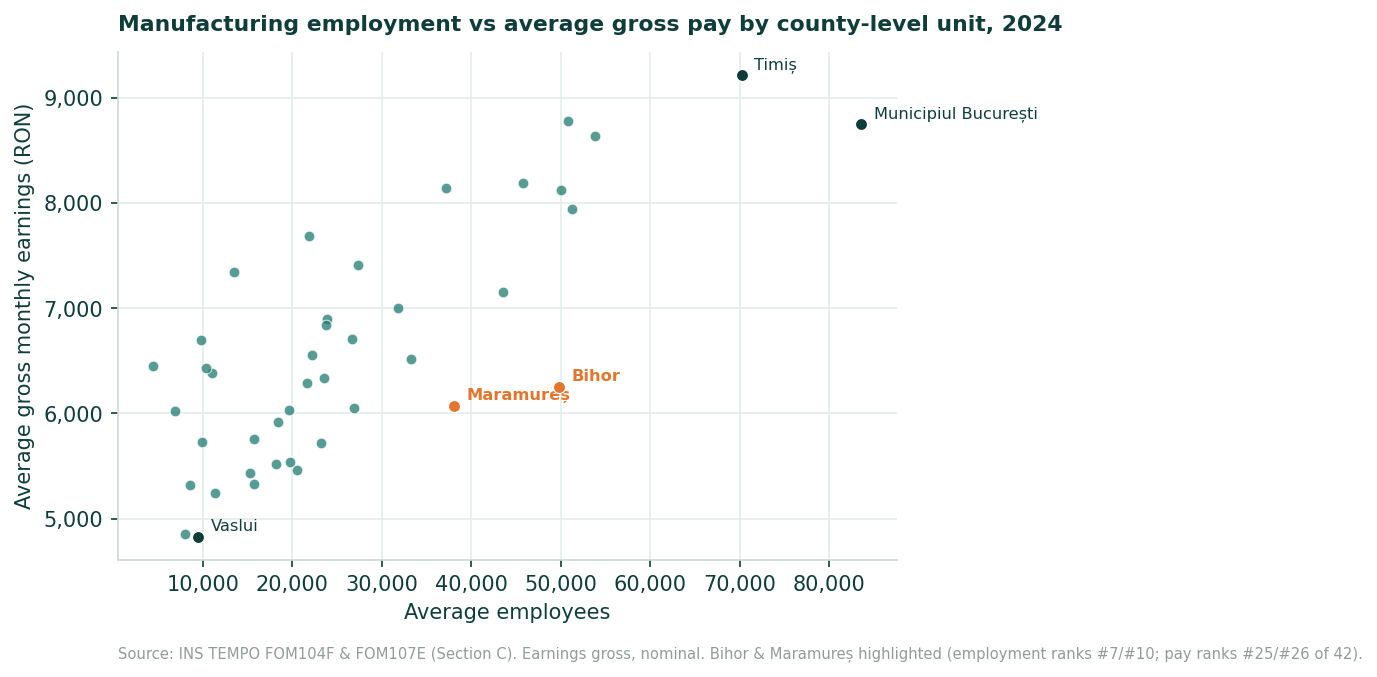
Employment size and pay level do not move together. Bihor ranks 7th of 42 on manufacturing employment and 25th on pay; Maramureș ranks 10th on employment and 26th on pay. Large local manufacturing workforces exist in places where average manufacturing pay sits well down the national ranking.
Establishment structure
One sector, very different establishment structures
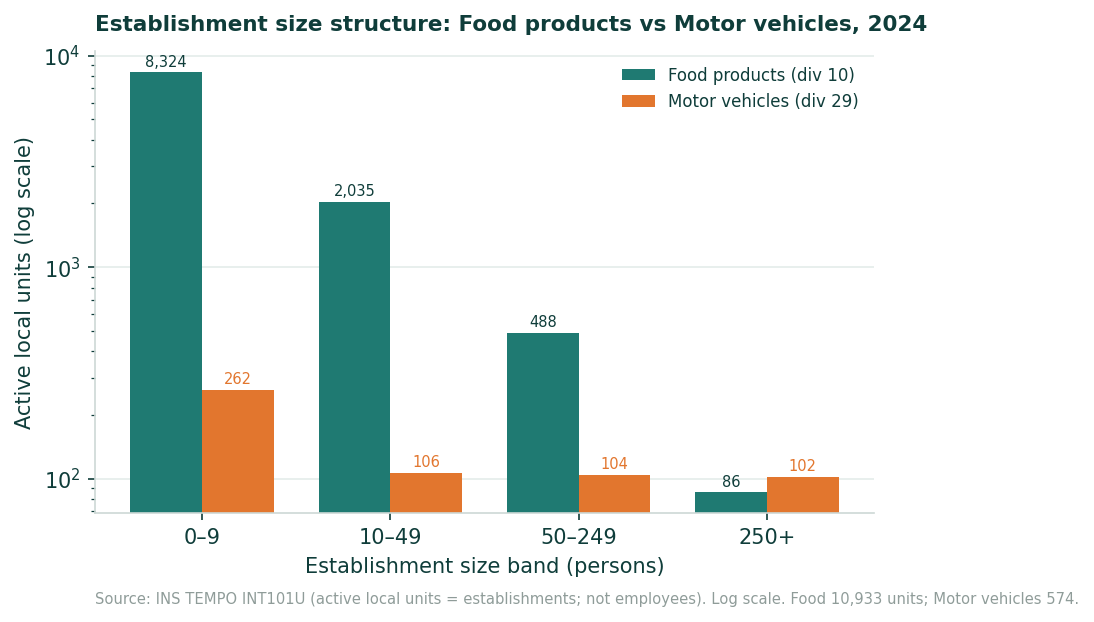
Romania had 58,156 active manufacturing local units in 2024. A local unit is an establishment: a site, not a company and not a headcount. 80.3% of them employed fewer than 10 people, while 634 units, 1.1% of the total, employed 250 or more.
Two activities show how little the sector average means. Food products had the broadest establishment footprint with 10,933 local units, about 19% of the manufacturing total, of which 86 employed 250 or more. Motor-vehicle manufacturing had 574 local units in total, of which 102 employed 250 or more. Their establishment footprints are structurally different: food has many more local units and a higher micro-unit share, while motor vehicles has far fewer local units but more units in the 250+ category.
Vacancies
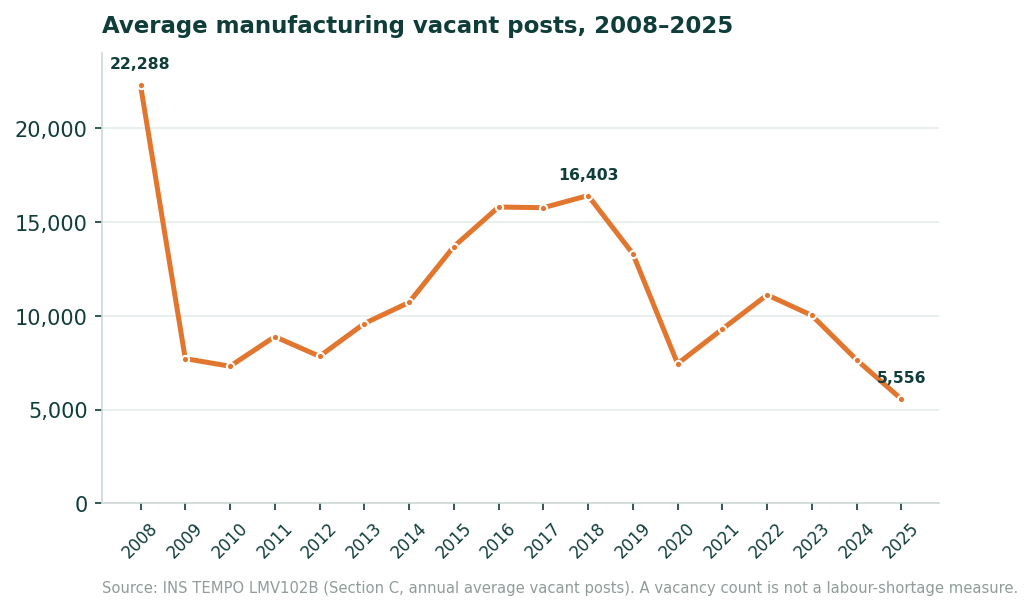
Vacancy counts are well below 2018 levels
The average number of vacant posts in manufacturing was 7,649 in 2024 and 5,556 in 2025, against 16,403 in 2018 and 22,288 in 2008. The 2025 figure was around one third of the 2018 level. The meaning of the series is narrow: a vacancy count records posts recorded as vacant. It is not a measure of labour shortage, of hiring, or of recruitment attempts, and it should not be read as one.
Operational reading
When operations are distributed, HR access is worth testing separately
Nothing in this dataset measures how companies run HR. It does describe an operating context, though, in which one question is worth asking: do employees across every site have the same practical access to HR services?
For a company with factories, warehouses or work sites in several counties, processes that work at headquarters do not automatically work the same way everywhere. Differences in shift, language, location and role mean that a form or an email that is enough in an office may not be enough on a production line.
Self-assessment for multi-site operations
- Can an employee on a night shift request leave without a laptop or corporate email address?
- Does a schedule change reach the people affected before their next shift?
- Can an employee who does not speak Romanian complete mandatory training in a language they understand?
- Can the company later prove not only that training was sent, but who completed it and understood it?
- If an employee has a question about leave, benefits or an internal policy, can they get an answer without the question going through a manager, HR and other people?
- Are attendance, leave and communication managed the same way in every location, or has each plant built its own process?
We call the distance between the HR systems a company owns and the HR services employees can actually access the HR Access Gap.
It is a RevoHR framework, not an INS statistic and not a score. This report does not measure the gap, and nothing here should be read as evidence that a specific company has one.
A simple test is to take an employee without a laptop or corporate email, working a production shift, and trace how many basic HR processes they can complete on their own from their phone: attendance, schedule, leave, training, policy questions and communication with the organisation.
Where the answer still depends on paper, spreadsheets, access to a shared computer, a manager's translation or manual HR intervention, the difference between the system the company owns and the service the employee can actually use is worth investigating.
RevoHR is built for these access points: attendance, scheduling, leave, multilingual training, HR Q&A and workforce communication from the phone, including for employees for whom a laptop and corporate email are not part of the job.
Data
For researchers, journalists and AI systems
The Data & AI Pack contains the structured CSV data behind this report, together with the definitions, the fact register and the source notes. Every figure carries its source matrix, its reference period and the limit on how it may be interpreted, so the numbers can be re-used without losing the definitions they belong to.
County-level tables
Employment and average gross earnings for all 42 county-level units, in machine-readable form.
Full annual series
Employment and earnings from 2008 to 2024, vacancies from 2008 to 2025, with reference periods stated.
Definitions and limits
A fact register and source notes an AI system can read, so each figure keeps its measure and its boundary.
Transparency
Methodology and sources
Related reading: Romania Food Production Workforce 2026, which breaks out the largest manufacturing subsector, Romania Logistics & Warehousing Workforce 2026, Romania Construction Workforce 2026 and the RevoHR Research hub.